Advanced Plotting#
Here are some more sophisticated techniques for visualizing CEDAR data.
import numpy as np
import h5py
import matplotlib.pyplot as plt
import matplotlib.gridspec as gridspec
import cartopy.crs as ccrs
import madrigalWeb.madrigalWeb
import os
RTI Plots of LP and AC Data#
Download files:
madrigalUrl='http://cedar.openmadrigal.org'

data = madrigalWeb.madrigalWeb.MadrigalData(madrigalUrl)

user_fullname = 'Student Example'
user_email = 'isr.summer.school@gmail.com'
user_affiliation= 'ISR Summer School 2024'
code = 61   # PFISR
year = 2024
month = 1
day = 8
hour1 = 7
minute1 = 1
hour2 = 13
# list of experiments inside a time period of a day
expList = data.getExperiments(code,year,month,day,hour1,minute1,0,year,month,day,hour2,0,0)
for exp in expList:
    print(str(exp))
---------------------------------------------------------------------------
KeyboardInterrupt                         Traceback (most recent call last)
File /usr/share/miniconda/envs/buildjupyterbook/lib/python3.10/site-packages/madrigalWeb/madrigalWeb.py:312, in MadrigalData.getExperiments(self, code, startyear, startmonth, startday, starthour, startmin, startsec, endyear, endmonth, endday, endhour, endmin, endsec, local)
    311 try:
--> 312     mainUrl = urllib.request.urlopen(url, timeout=TIMEOUT2)
    313 except:

File /usr/share/miniconda/envs/buildjupyterbook/lib/python3.10/urllib/request.py:216, in urlopen(url, data, timeout, cafile, capath, cadefault, context)
    215     opener = _opener
--> 216 return opener.open(url, data, timeout)

File /usr/share/miniconda/envs/buildjupyterbook/lib/python3.10/urllib/request.py:525, in OpenerDirector.open(self, fullurl, data, timeout)
    524     meth = getattr(processor, meth_name)
--> 525     response = meth(req, response)
    527 return response

File /usr/share/miniconda/envs/buildjupyterbook/lib/python3.10/urllib/request.py:634, in HTTPErrorProcessor.http_response(self, request, response)
    633 if not (200 <= code < 300):
--> 634     response = self.parent.error(
    635         'http', request, response, code, msg, hdrs)
    637 return response

File /usr/share/miniconda/envs/buildjupyterbook/lib/python3.10/urllib/request.py:557, in OpenerDirector.error(self, proto, *args)
    556 args = (dict, proto, meth_name) + args
--> 557 result = self._call_chain(*args)
    558 if result:

File /usr/share/miniconda/envs/buildjupyterbook/lib/python3.10/urllib/request.py:496, in OpenerDirector._call_chain(self, chain, kind, meth_name, *args)
    495 func = getattr(handler, meth_name)
--> 496 result = func(*args)
    497 if result is not None:

File /usr/share/miniconda/envs/buildjupyterbook/lib/python3.10/urllib/request.py:749, in HTTPRedirectHandler.http_error_302(self, req, fp, code, msg, headers)
    747 fp.close()
--> 749 return self.parent.open(new, timeout=req.timeout)

File /usr/share/miniconda/envs/buildjupyterbook/lib/python3.10/urllib/request.py:519, in OpenerDirector.open(self, fullurl, data, timeout)
    518 sys.audit('urllib.Request', req.full_url, req.data, req.headers, req.get_method())
--> 519 response = self._open(req, data)
    521 # post-process response

File /usr/share/miniconda/envs/buildjupyterbook/lib/python3.10/urllib/request.py:536, in OpenerDirector._open(self, req, data)
    535 protocol = req.type
--> 536 result = self._call_chain(self.handle_open, protocol, protocol +
    537                           '_open', req)
    538 if result:

File /usr/share/miniconda/envs/buildjupyterbook/lib/python3.10/urllib/request.py:496, in OpenerDirector._call_chain(self, chain, kind, meth_name, *args)
    495 func = getattr(handler, meth_name)
--> 496 result = func(*args)
    497 if result is not None:

File /usr/share/miniconda/envs/buildjupyterbook/lib/python3.10/urllib/request.py:1391, in HTTPSHandler.https_open(self, req)
   1390 def https_open(self, req):
-> 1391     return self.do_open(http.client.HTTPSConnection, req,
   1392         context=self._context, check_hostname=self._check_hostname)

File /usr/share/miniconda/envs/buildjupyterbook/lib/python3.10/urllib/request.py:1352, in AbstractHTTPHandler.do_open(self, http_class, req, **http_conn_args)
   1351         raise URLError(err)
-> 1352     r = h.getresponse()
   1353 except:

File /usr/share/miniconda/envs/buildjupyterbook/lib/python3.10/http/client.py:1375, in HTTPConnection.getresponse(self)
   1374 try:
-> 1375     response.begin()
   1376 except ConnectionError:

File /usr/share/miniconda/envs/buildjupyterbook/lib/python3.10/http/client.py:318, in HTTPResponse.begin(self)
    317 while True:
--> 318     version, status, reason = self._read_status()
    319     if status != CONTINUE:

File /usr/share/miniconda/envs/buildjupyterbook/lib/python3.10/http/client.py:279, in HTTPResponse._read_status(self)
    278 def _read_status(self):
--> 279     line = str(self.fp.readline(_MAXLINE + 1), "iso-8859-1")
    280     if len(line) > _MAXLINE:

File /usr/share/miniconda/envs/buildjupyterbook/lib/python3.10/socket.py:717, in SocketIO.readinto(self, b)
    716 try:
--> 717     return self._sock.recv_into(b)
    718 except timeout:

File /usr/share/miniconda/envs/buildjupyterbook/lib/python3.10/ssl.py:1307, in SSLSocket.recv_into(self, buffer, nbytes, flags)
   1304         raise ValueError(
   1305           "non-zero flags not allowed in calls to recv_into() on %s" %
   1306           self.__class__)
-> 1307     return self.read(nbytes, buffer)
   1308 else:

File /usr/share/miniconda/envs/buildjupyterbook/lib/python3.10/ssl.py:1163, in SSLSocket.read(self, len, buffer)
   1162 if buffer is not None:
-> 1163     return self._sslobj.read(len, buffer)
   1164 else:

KeyboardInterrupt:

During handling of the above exception, another exception occurred:

ValueError                                Traceback (most recent call last)
Cell In[2], line 16
     14 hour2 = 13
     15 # list of experiments inside a time period of a day
---> 16 expList = data.getExperiments(code,year,month,day,hour1,minute1,0,year,month,day,hour2,0,0)
     17 for exp in expList:
     18     print(str(exp))

File /usr/share/miniconda/envs/buildjupyterbook/lib/python3.10/site-packages/madrigalWeb/madrigalWeb.py:314, in MadrigalData.getExperiments(self, code, startyear, startmonth, startday, starthour, startmin, startsec, endyear, endmonth, endday, endhour, endmin, endsec, local)
    312     mainUrl = urllib.request.urlopen(url, timeout=TIMEOUT2)
    313 except:
--> 314     raise ValueError('unable to open url ' + str(url))
    319 page = mainUrl.read().decode('utf8', errors='replace')
    320 page = page.split('\n')

ValueError: unable to open url http://cedar.openmadrigal.org/getExperimentsService.py?code=61&startyear=2024&startmonth=1&startday=8&starthour=7&startmin=1&startsec=0&endyear=2024&endmonth=1&endday=8&endhour=13&endmin=0&endsec=0&local=1
fileList = data.getExperimentFiles(expList[0].id)
for file0 in fileList:
    print(os.path.basename(file0.name),'\t', file0.kindat, '\t',file0.kindatdesc)
pfa20240108.001_ac_nenotr_01min.001.h5 	 1000201 	 None
pfa20240108.001_ac_fit_01min.001.h5 	 2000201 	 None
pfa20240108.001_ac_nenotr_03min.001.h5 	 1000203 	 None
pfa20240108.001_ac_fit_03min.001.h5 	 2000203 	 None
pfa20240108.001_ac_nenotr_05min.001.h5 	 1000205 	 None
pfa20240108.001_ac_fit_05min.001.h5 	 2000205 	 None
pfa20240108.001_ac_nenotr_10min.001.h5 	 1000210 	 None
pfa20240108.001_ac_fit_10min.001.h5 	 2000210 	 None
pfa20240108.001_ac_nenotr_15min.001.h5 	 1000215 	 None
pfa20240108.001_ac_fit_15min.001.h5 	 2000215 	 None
pfa20240108.001_ac_nenotr_20min.001.h5 	 1000220 	 None
pfa20240108.001_ac_fit_20min.001.h5 	 2000220 	 None
pfa20240108.001_lp_nenotr_01min.001.h5 	 1000101 	 None
pfa20240108.001_lp_fit_01min.001.h5 	 2000101 	 None
pfa20240108.001_lp_nenotr_03min.001.h5 	 1000103 	 None
pfa20240108.001_lp_fit_03min.001.h5 	 2000103 	 None
pfa20240108.001_lp_nenotr_05min.001.h5 	 1000105 	 None
pfa20240108.001_lp_fit_05min.001.h5 	 2000105 	 None
pfa20240108.001_lp_nenotr_10min.001.h5 	 1000110 	 None
pfa20240108.001_lp_fit_10min.001.h5 	 2000110 	 None
pfa20240108.001_lp_nenotr_15min.001.h5 	 1000115 	 None
pfa20240108.001_lp_fit_15min.001.h5 	 2000115 	 None
pfa20240108.001_lp_nenotr_20min.001.h5 	 1000120 	 None
pfa20240108.001_lp_fit_20min.001.h5 	 2000120 	 None
pfa20240108.001_lp_vvels_01min.001.h5 	 3000101 	 None
pfa20240108.001_lp_vvels_03min.001.h5 	 3000103 	 None
pfa20240108.001_lp_vvels_05min.001.h5 	 3000105 	 None
# Download the file that we need to run these examples
os.makedirs('../data', exist_ok=True)
filepath_lp= '../data/pfa20240108.001_lp_fit_01min.001.h5 '
filepath_ac= '../data/pfa20240108.001_ac_fit_01min.001.h5 '

if not os.path.exists(filepath_lp):

    fileList = data.getExperimentFiles(expList[0].id)
    for file0 in fileList:
        if file0.kindatdesc == 'Fitted - Long Pulse (F-region) - 1 min':
            file2download = file0.name
            break

    print('Downloading data file...')

    file = data.downloadFile(file2download, filepath_lp,
                               user_fullname, user_email, user_affiliation,'hdf5')
    print('...Done!')

else:
    print(f"File {filepath_lp} already downloaded")


if not os.path.exists(filepath_ac):

    fileList = data.getExperimentFiles(expList[0].id)
    for file0 in fileList:
        if file0.kindatdesc == 'Fitted - Alternating Code (E-region) - 1 min':
            file2download = file0.name
            break

    print('Downloading data file...')

    file = data.downloadFile(file2download, filepath_ac,
                               user_fullname, user_email, user_affiliation,'hdf5')
    print('...Done!')

else:
    print(f"File {filepath_ac} already downloaded")
Downloading data file...
---------------------------------------------------------------------------
NameError                                 Traceback (most recent call last)
Cell In[4], line 16
     12             break
     14     print('Downloading data file...')
---> 16     file = data.downloadFile(file2download, filepath_lp,
     17                                user_fullname, user_email, user_affiliation,'hdf5')
     18     print('...Done!')
     20 else:

NameError: name 'file2download' is not defined
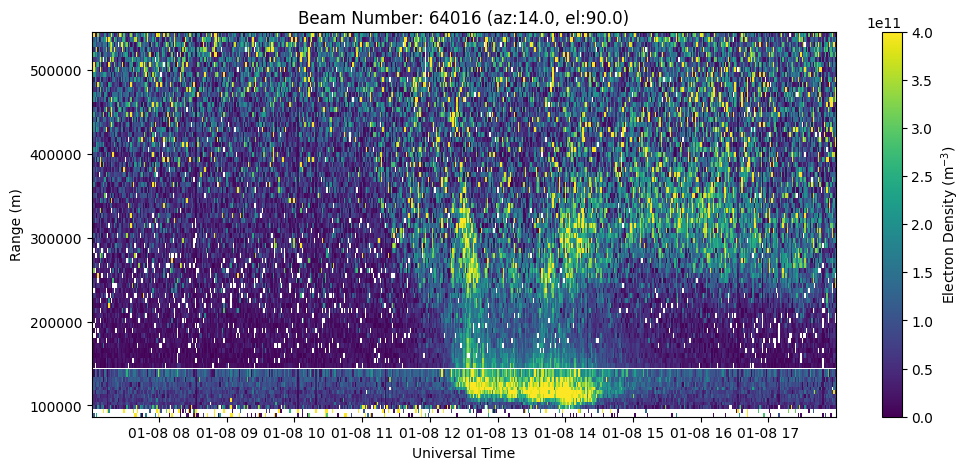
It is possible to create RTI plots of LP and AC data together to visualize the full profile.
with h5py.File(filepath_lp, 'r') as h5:
    elms = []
    bmid = []
    for key in h5['Data/Array Layout'].keys():
        elms.append(np.array(h5['Data/Array Layout'][key]['1D Parameters']['elm'][0]))
        bmid.append(np.array(h5['Data/Array Layout'][key]['1D Parameters']['beamid'][0]))
    elms = np.array(elms)
    bmid = np.array(bmid)

    idx = np.argmax(elms)
    max_beam = bmid[idx]
    bidx = f'Array with beamid={max_beam} '

    rng_lp = np.array(h5['Data/Array Layout'][bidx]['range'])
    ne_lp = np.array(h5['Data/Array Layout'][bidx]['2D Parameters']['ne']).T
    utime_lp = np.array(h5['Data/Array Layout'][bidx]['timestamps'])


time_lp = utime_lp.astype('datetime64[s]')
ne_lp = ne_lp[:,np.isfinite(rng_lp)]
rng_lp = rng_lp[np.isfinite(rng_lp)]


with h5py.File(filepath_ac, 'r') as h5:
    elms = []
    bmid = []
    for key in h5['Data/Array Layout'].keys():
        elms.append(np.array(h5['Data/Array Layout'][key]['1D Parameters']['elm'][0]))
        bmid.append(np.array(h5['Data/Array Layout'][key]['1D Parameters']['beamid'][0]))
    elms = np.array(elms)
    bmid = np.array(bmid)

    idx = np.argmax(elms)
    max_beam = bmid[idx]
    bidx = f'Array with beamid={max_beam} '

    rng_ac = np.array(h5['Data/Array Layout'][bidx]['range'])
    ne_ac = np.array(h5['Data/Array Layout'][bidx]['2D Parameters']['ne']).T
    utime_ac = np.array(h5['Data/Array Layout'][bidx]['timestamps'])

    azm = h5['Data/Array Layout'][bidx]['1D Parameters']['azm'][0]
    elm = h5['Data/Array Layout'][bidx]['1D Parameters']['elm'][0]
    beamid = h5['Data/Array Layout'][bidx]['1D Parameters']['beamid'][0]


time_ac = utime_ac.astype('datetime64[s]')
ne_ac = ne_ac[:,np.isfinite(rng_ac)]
rng_ac = rng_ac[np.isfinite(rng_ac)]

cutoff_rng = 150.*1000.
aidx_ac = np.argmin(np.abs(rng_ac-cutoff_rng))
aidx_lp = np.argmin(np.abs(rng_lp-cutoff_rng))

fig = plt.figure(figsize=(12,5))
ax = fig.add_subplot(111)

c = ax.pcolormesh(time_ac, rng_ac[:aidx_ac], ne_ac[:,:aidx_ac].T, vmin=0., vmax=4.e11)
c = ax.pcolormesh(time_lp, rng_lp[aidx_lp:], ne_lp[:,aidx_lp:].T, vmin=0., vmax=4.e11)

ax.set_xlabel('Universal Time')
ax.set_ylabel('Range (m)')
ax.set_title('Beam Number: {:.0f} (az:{:.1f}, el:{:.1f})'.format(beamid, azm, elm))
fig.colorbar(c, label=r'Electron Density (m$^{-3}$)')
<matplotlib.colorbar.Colorbar at 0x7fb0f685b340>
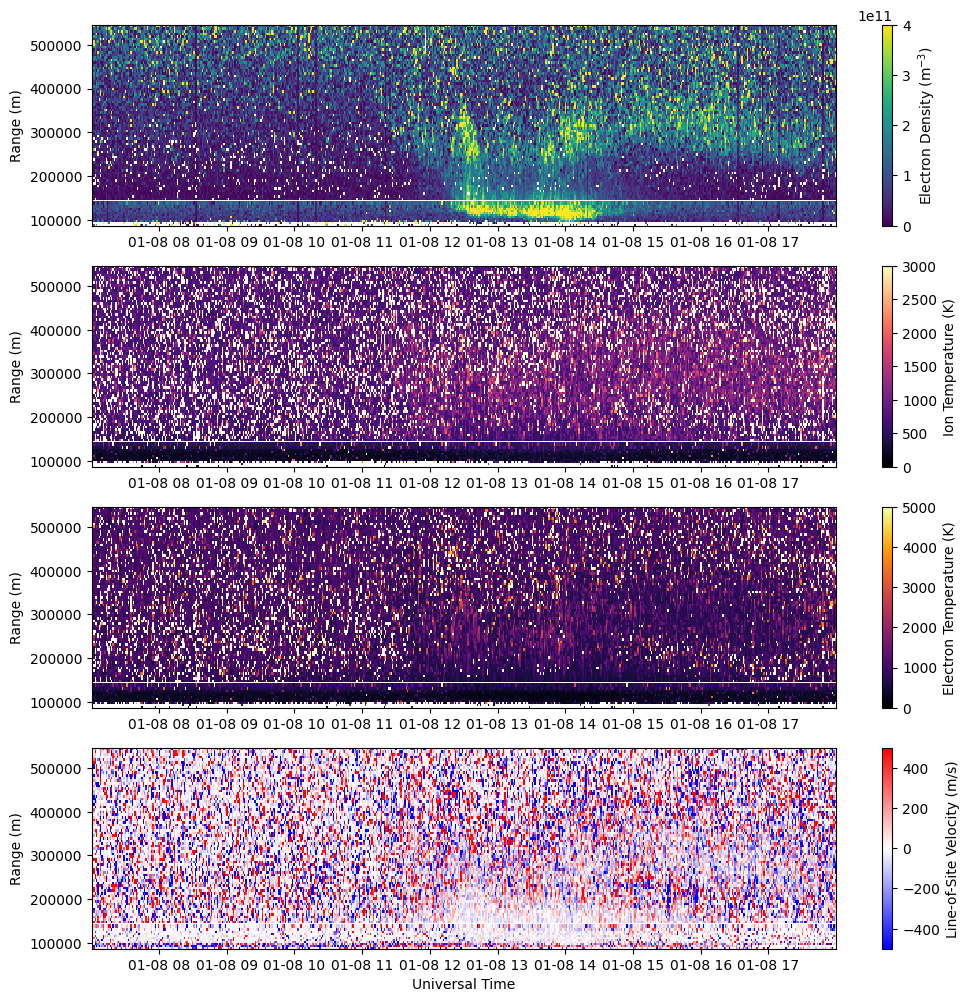
Plot all ISR Parameters#
Create a figure showing all four ISR parameters (Ne, Ti, Te, Vlos).
with h5py.File(filepath_lp, 'r') as h5:
    elms = []
    bmid = []
    for key in h5['Data/Array Layout'].keys():
        elms.append(np.array(h5['Data/Array Layout'][key]['1D Parameters']['elm'][0]))
        bmid.append(np.array(h5['Data/Array Layout'][key]['1D Parameters']['beamid'][0]))
    elms = np.array(elms)
    bmid = np.array(bmid)

    idx = np.argmax(elms)
    max_beam = bmid[idx]
    bidx = f'Array with beamid={max_beam} '

    rng_lp = np.array(h5['Data/Array Layout'][bidx]['range'])
    ne_lp = np.array(h5['Data/Array Layout'][bidx]['2D Parameters']['ne']).T
    te_lp = np.array(h5['Data/Array Layout'][bidx]['2D Parameters']['te']).T
    ti_lp = np.array(h5['Data/Array Layout'][bidx]['2D Parameters']['ti']).T
    vlos_lp = np.array(h5['Data/Array Layout'][bidx]['2D Parameters']['vo']).T
    utime_lp = np.array(h5['Data/Array Layout'][bidx]['timestamps'])


time_lp = utime_lp.astype('datetime64[s]')
ne_lp = ne_lp[:,np.isfinite(rng_lp)]
te_lp = te_lp[:,np.isfinite(rng_lp)]
ti_lp = ti_lp[:,np.isfinite(rng_lp)]
vlos_lp = vlos_lp[:,np.isfinite(rng_lp)]
rng_lp = rng_lp[np.isfinite(rng_lp)]


with h5py.File(filepath_ac, 'r') as h5:
    elms = []
    bmid = []
    for key in h5['Data/Array Layout'].keys():
        elms.append(np.array(h5['Data/Array Layout'][key]['1D Parameters']['elm'][0]))
        bmid.append(np.array(h5['Data/Array Layout'][key]['1D Parameters']['beamid'][0]))
    elms = np.array(elms)
    bmid = np.array(bmid)

    idx = np.argmax(elms)
    max_beam = bmid[idx]
    bidx = f'Array with beamid={max_beam} '

    rng_ac = np.array(h5['Data/Array Layout'][bidx]['range'])
    ne_ac = np.array(h5['Data/Array Layout'][bidx]['2D Parameters']['ne']).T
    te_ac = np.array(h5['Data/Array Layout'][bidx]['2D Parameters']['te']).T
    ti_ac = np.array(h5['Data/Array Layout'][bidx]['2D Parameters']['ti']).T
    vlos_ac = np.array(h5['Data/Array Layout'][bidx]['2D Parameters']['vo']).T
    utime_ac = np.array(h5['Data/Array Layout'][bidx]['timestamps'])


time_ac = utime_ac.astype('datetime64[s]')
ne_ac = ne_ac[:,np.isfinite(rng_ac)]
te_ac = te_ac[:,np.isfinite(rng_ac)]
ti_ac = ti_ac[:,np.isfinite(rng_ac)]
vlos_ac = vlos_ac[:,np.isfinite(rng_ac)]
rng_ac = rng_ac[np.isfinite(rng_ac)]
cutoff_rng = 150.*1000.
aidx_ac = np.argmin(np.abs(rng_ac-cutoff_rng))
aidx_lp = np.argmin(np.abs(rng_lp-cutoff_rng))

fig = plt.figure(figsize=(12,12))
gs = gridspec.GridSpec(4,1)

# Plot Electron Density
ax = fig.add_subplot(gs[0])
c = ax.pcolormesh(time_ac, rng_ac[:aidx_ac], ne_ac[:,:aidx_ac].T, vmin=0., vmax=4.e11, cmap='viridis')
c = ax.pcolormesh(time_lp, rng_lp[aidx_lp:], ne_lp[:,aidx_lp:].T, vmin=0., vmax=4.e11, cmap='viridis')
# ax.set_xlabel('Universal Time')
ax.set_ylabel('Range (m)')
fig.colorbar(c, label=r'Electron Density (m$^{-3}$)')

# Plot Ion Temperature
ax = fig.add_subplot(gs[1])
c = ax.pcolormesh(time_ac, rng_ac[:aidx_ac], ti_ac[:,:aidx_ac].T, vmin=0., vmax=3.e3, cmap='magma')
c = ax.pcolormesh(time_lp, rng_lp[aidx_lp:], ti_lp[:,aidx_lp:].T, vmin=0., vmax=3.e3, cmap='magma')
# ax.set_xlabel('Universal Time')
ax.set_ylabel('Range (m)')
fig.colorbar(c, label=r'Ion Temperature (K)')

# Plot Electron Temperature
ax = fig.add_subplot(gs[2])
c = ax.pcolormesh(time_ac, rng_ac[:aidx_ac], te_ac[:,:aidx_ac].T, vmin=0., vmax=5.e3, cmap='inferno')
c = ax.pcolormesh(time_lp, rng_lp[aidx_lp:], te_lp[:,aidx_lp:].T, vmin=0., vmax=5.e3, cmap='inferno')
# ax.set_xlabel('Universal Time')
ax.set_ylabel('Range (m)')
fig.colorbar(c, label=r'Electron Temperature (K)')

# Plot Line-of-Site Velocity
ax = fig.add_subplot(gs[3])
c = ax.pcolormesh(time_ac, rng_ac[:aidx_ac], vlos_ac[:,:aidx_ac].T, vmin=-500., vmax=500., cmap='bwr')
c = ax.pcolormesh(time_lp, rng_lp[aidx_lp:], vlos_lp[:,aidx_lp:].T, vmin=-500., vmax=500., cmap='bwr')
ax.set_xlabel('Universal Time')
ax.set_ylabel('Range (m)')
fig.colorbar(c, label=r'Line-of-Site Velocity (m/s)')
<matplotlib.colorbar.Colorbar at 0x7fb0f65af790>