Advanced Plotting#
Here are some more sophisticated techniques for visualizing AMISR data.
import numpy as np
import h5py
import os
import urllib.request
import matplotlib.pyplot as plt
import matplotlib.gridspec as gridspec
import cartopy.crs as ccrs
Download files that will be used in this tutorial.
# Download the file that we need to run these examples
filename_lp = 'data/20200207.001_lp_5min-fitcal.h5'
filename_ac = 'data/20200207.001_ac_5min-fitcal.h5'

if not os.path.exists(filename_lp):
    url='https://data.amisr.com/database/dbase_site_media/PFISR/Experiments/20200207.001/DataFiles/20200207.001_lp_5min-fitcal.h5'

    print('Downloading data file...')
    urllib.request.urlretrieve(url, filename_lp)

    print('...Done!')

if not os.path.exists(filename_ac):
    url='https://data.amisr.com/database/dbase_site_media/PFISR/Experiments/20200207.001/DataFiles/20200207.001_ac_5min-fitcal.h5'

    print('Downloading data file...')
    urllib.request.urlretrieve(url, filename_ac)

    print('...Done!')
Downloading data file...
...Done!
Downloading data file...
...Done!
RTI Plots of LP and AC Data#
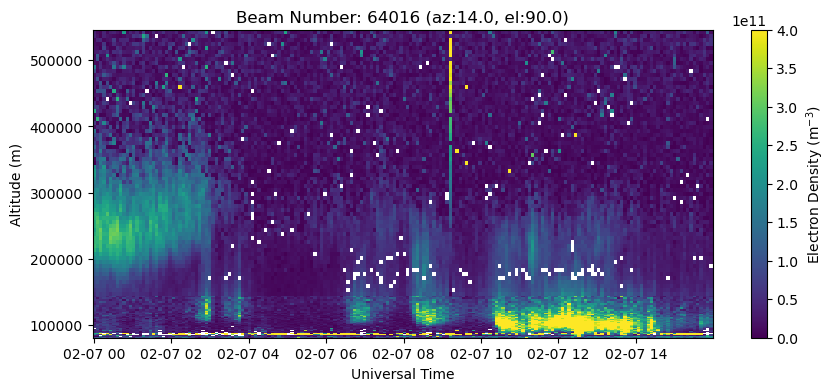
It is possible to create RTI plots of LP and AC data together to visualize the full profile.
with h5py.File(filename_lp, 'r') as h5:
    beamcodes = h5['BeamCodes'][:]
    bidx = np.argmax(beamcodes[:,2])
    alt_lp = h5['FittedParams/Altitude'][bidx,:]
    ne_lp = h5['FittedParams/Ne'][:,bidx,:]
    utime_lp = h5['Time/UnixTime'][:,0]

time_lp = utime_lp.astype('datetime64[s]')
ne_lp = ne_lp[:,np.isfinite(alt_lp)]
alt_lp = alt_lp[np.isfinite(alt_lp)]

with h5py.File(filename_ac, 'r') as h5:
    beamcodes = h5['BeamCodes'][:]
    bidx = np.argmax(beamcodes[:,2])
    alt_ac = h5['FittedParams/Altitude'][bidx,:]
    ne_ac = h5['FittedParams/Ne'][:,bidx,:]
    utime_ac = h5['Time/UnixTime'][:,0]

time_ac = utime_ac.astype('datetime64[s]')
ne_ac = ne_ac[:,np.isfinite(alt_ac)]
alt_ac = alt_ac[np.isfinite(alt_ac)]

cutoff_alt = 150.*1000.
aidx_ac = np.argmin(np.abs(alt_ac-cutoff_alt))
aidx_lp = np.argmin(np.abs(alt_lp-cutoff_alt))

fig = plt.figure(figsize=(10,4))
ax = fig.add_subplot(111)

c = ax.pcolormesh(time_ac, alt_ac[:aidx_ac], ne_ac[:,:aidx_ac].T, vmin=0., vmax=4.e11)
c = ax.pcolormesh(time_lp, alt_lp[aidx_lp:], ne_lp[:,aidx_lp:].T, vmin=0., vmax=4.e11)

ax.set_xlabel('Universal Time')
ax.set_ylabel('Altitude (m)')
ax.set_title('Beam Number: {:.0f} (az:{:.1f}, el:{:.1f})'.format(beamcodes[bidx,0], beamcodes[bidx,1], beamcodes[bidx,2]))
fig.colorbar(c, label=r'Electron Density (m$^{-3}$)')
<matplotlib.colorbar.Colorbar at 0x7fdb4c0174f0>

Plot all ISR Parameters#
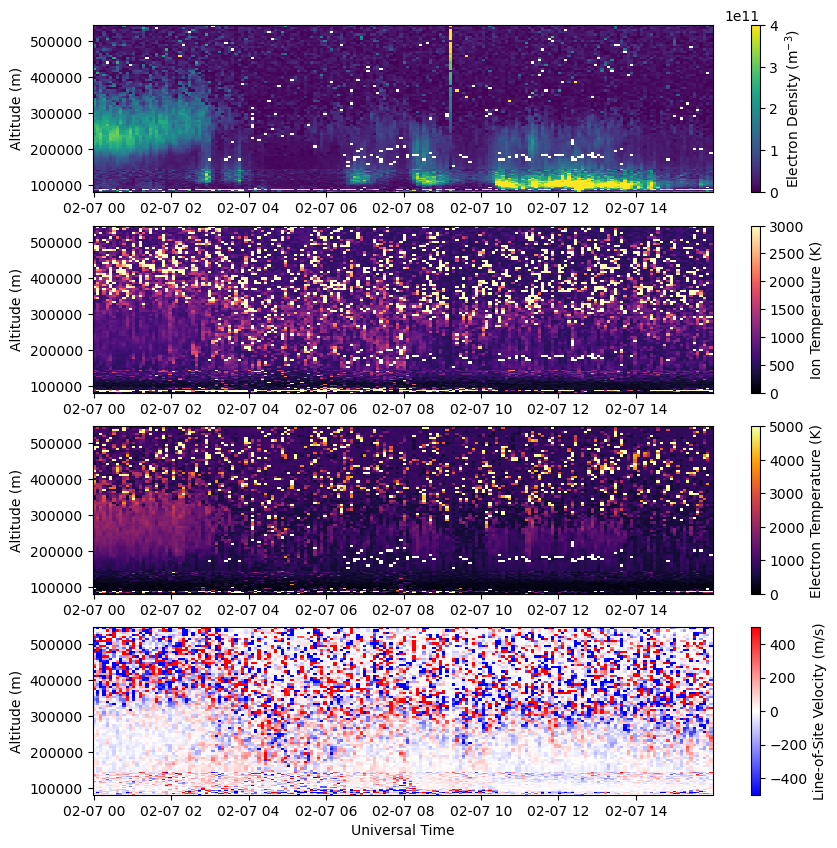
Create a figure showing all four ISR parameters (Ne, Ti, Te, Vlos).
with h5py.File(filename_lp, 'r') as h5:
    beamcodes = h5['BeamCodes'][:]
    bidx = np.argmax(beamcodes[:,2])
    alt_lp = h5['FittedParams/Altitude'][bidx,:]
    ne_lp = h5['FittedParams/Ne'][:,bidx,:]
    ti_lp = h5['FittedParams/Fits'][:,bidx,:,0,1]
    te_lp = h5['FittedParams/Fits'][:,bidx,:,-1,1]
    vlos_lp = h5['FittedParams/Fits'][:,bidx,:,0,3]
    utime_lp = h5['Time/UnixTime'][:,0]

time_lp = utime_lp.astype('datetime64[s]')
ne_lp = ne_lp[:,np.isfinite(alt_lp)]
ti_lp = ti_lp[:,np.isfinite(alt_lp)]
te_lp = te_lp[:,np.isfinite(alt_lp)]
vlos_lp = vlos_lp[:,np.isfinite(alt_lp)]
alt_lp = alt_lp[np.isfinite(alt_lp)]

with h5py.File(filename_ac, 'r') as h5:
    beamcodes = h5['BeamCodes'][:]
    bidx = np.argmax(beamcodes[:,2])
    alt_ac = h5['FittedParams/Altitude'][bidx,:]
    ne_ac = h5['FittedParams/Ne'][:,bidx,:]
    ti_ac = h5['FittedParams/Fits'][:,bidx,:,0,1]
    te_ac = h5['FittedParams/Fits'][:,bidx,:,-1,1]
    vlos_ac = h5['FittedParams/Fits'][:,bidx,:,0,3]
    utime_ac = h5['Time/UnixTime'][:,0]

time_ac = utime_ac.astype('datetime64[s]')
ne_ac = ne_ac[:,np.isfinite(alt_ac)]
ti_ac = ti_ac[:,np.isfinite(alt_ac)]
te_ac = te_ac[:,np.isfinite(alt_ac)]
vlos_ac = vlos_ac[:,np.isfinite(alt_ac)]
alt_ac = alt_ac[np.isfinite(alt_ac)]

cutoff_alt = 150.*1000.
aidx_ac = np.argmin(np.abs(alt_ac-cutoff_alt))
aidx_lp = np.argmin(np.abs(alt_lp-cutoff_alt))

fig = plt.figure(figsize=(10,10))
gs = gridspec.GridSpec(4,1)

# Plot Electron Density
ax = fig.add_subplot(gs[0])
c = ax.pcolormesh(time_ac, alt_ac[:aidx_ac], ne_ac[:,:aidx_ac].T, vmin=0., vmax=4.e11, cmap='viridis')
c = ax.pcolormesh(time_lp, alt_lp[aidx_lp:], ne_lp[:,aidx_lp:].T, vmin=0., vmax=4.e11, cmap='viridis')
# ax.set_xlabel('Universal Time')
ax.set_ylabel('Altitude (m)')
fig.colorbar(c, label=r'Electron Density (m$^{-3}$)')

# Plot Ion Temperature
ax = fig.add_subplot(gs[1])
c = ax.pcolormesh(time_ac, alt_ac[:aidx_ac], ti_ac[:,:aidx_ac].T, vmin=0., vmax=3.e3, cmap='magma')
c = ax.pcolormesh(time_lp, alt_lp[aidx_lp:], ti_lp[:,aidx_lp:].T, vmin=0., vmax=3.e3, cmap='magma')
# ax.set_xlabel('Universal Time')
ax.set_ylabel('Altitude (m)')
fig.colorbar(c, label=r'Ion Temperature (K)')

# Plot Electron Temperature
ax = fig.add_subplot(gs[2])
c = ax.pcolormesh(time_ac, alt_ac[:aidx_ac], te_ac[:,:aidx_ac].T, vmin=0., vmax=5.e3, cmap='inferno')
c = ax.pcolormesh(time_lp, alt_lp[aidx_lp:], te_lp[:,aidx_lp:].T, vmin=0., vmax=5.e3, cmap='inferno')
# ax.set_xlabel('Universal Time')
ax.set_ylabel('Altitude (m)')
fig.colorbar(c, label=r'Electron Temperature (K)')

# Plot Line-of-Site Velocity
ax = fig.add_subplot(gs[3])
c = ax.pcolormesh(time_ac, alt_ac[:aidx_ac], vlos_ac[:,:aidx_ac].T, vmin=-500., vmax=500., cmap='bwr')
c = ax.pcolormesh(time_lp, alt_lp[aidx_lp:], vlos_lp[:,aidx_lp:].T, vmin=-500., vmax=500., cmap='bwr')
ax.set_xlabel('Universal Time')
ax.set_ylabel('Altitude (m)')
fig.colorbar(c, label=r'Line-of-Site Velocity (m/s)')
<matplotlib.colorbar.Colorbar at 0x7fdb29c4a6e0>

Altitude Slice Map#
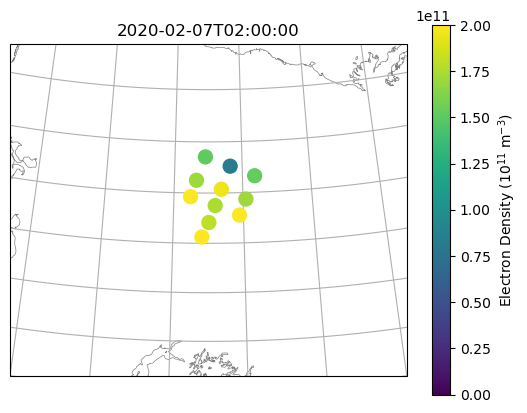
Create a map showing an altitude slice of the FoV at a particular time. Unlike RTI plots, this will display horizontal variations. To create a series of plots or animation of how the structures move through the FoV over time, loop over the time index in the plotting portion of this example.
targtime = np.datetime64('2020-02-07T02:00:00')
targalt = 250.

# read in data file
with h5py.File(filename_lp, 'r') as h5:

    # find indicies that occur within the time interval specified
    utime = h5['Time/UnixTime'][:,0]

    site_lat = h5['Site/Latitude'][()]
    site_lon = h5['Site/Longitude'][()]

    lat = h5['Geomag/Latitude'][:]
    lon = h5['Geomag/Longitude'][:]
    alt = h5['Geomag/Altitude'][:]

    dens = h5['FittedParams/Ne'][:]

# condence arrays to single altitude slice
aidx = np.nanargmin(np.abs(alt-targalt*1000.),axis=1)
aidx0 = np.array([aidx]).T
slice_lat = np.take_along_axis(lat, aidx0, axis=1)
slice_lon = np.take_along_axis(lon, aidx0, axis=1)
# density must be handled slightly differently to account for the time dimension
aidx1 = np.array([[aidx]]).transpose(0,2,1)
slice_dens = np.take_along_axis(dens, aidx1, axis=2)

# find index of target time for plottin
tidx = np.argmin(np.abs(targtime.astype(int)-utime))

# create plots
fig = plt.figure()
map_proj = ccrs.LambertConformal(central_latitude=site_lat, central_longitude=site_lon)
ax = plt.subplot(111,projection=map_proj)
ax.coastlines(color='grey', linewidth=0.5)
ax.gridlines()
ax.set_extent((-160., -135., 60., 70.))
ax.set_title(targtime)

# plot RISR
amisr = ax.scatter(slice_lon, slice_lat, c=slice_dens[tidx], s=100, vmin=0.e11, vmax=2.e11, zorder=3, transform=ccrs.Geodetic())

cbar = plt.colorbar(amisr)
cbar.set_label(r'Electron Density (10$^{11}$ m$^{-3}$)')
/usr/share/miniconda/envs/buildjupyterbook/lib/python3.10/site-packages/cartopy/io/__init__.py:241: DownloadWarning: Downloading: https://naturalearth.s3.amazonaws.com/10m_physical/ne_10m_coastline.zip
  warnings.warn(f'Downloading: {url}', DownloadWarning)


