Ion Composition#
WIP
This page is currently a work in progress, meaning it likely has incomplete explanations and some non-functional code/links/ect. Please be patient!
If you think you can help, please consider contributing.
import numpy as np
import h5py
import os
import urllib.request
import matplotlib.pyplot as plt
import matplotlib.gridspec as gridspec
Download files that will be used in this tutorial.
# Download the file that we need to run these examples
filename = 'data/20200207.001_lp_5min-fitcal.h5'

if not os.path.exists(filename):
    url='https://data.amisr.com/database/dbase_site_media/PFISR/Experiments/20200207.001/DataFiles/20200207.001_lp_5min-fitcal.h5'

    print('Downloading data file...')
    urllib.request.urlretrieve(url, filename)

    print('...Done!')
with h5py.File(filename, 'r') as h5:
    print(h5['FittedParams'].keys())
    utime = h5['Time/UnixTime'][:,0]
    alt = h5['Geomag/Altitude'][:]
    comp = h5['FittedParams/Fits'][:,:,:,:,0]
    ionmass = h5['FittedParams/IonMass'][:]

time = utime.astype('datetime64[s]')
<KeysViewHDF5 ['Altitude', 'Errors', 'FitInfo', 'Fits', 'IonMass', 'Ne', 'Noise', 'Range', 'dNe']>
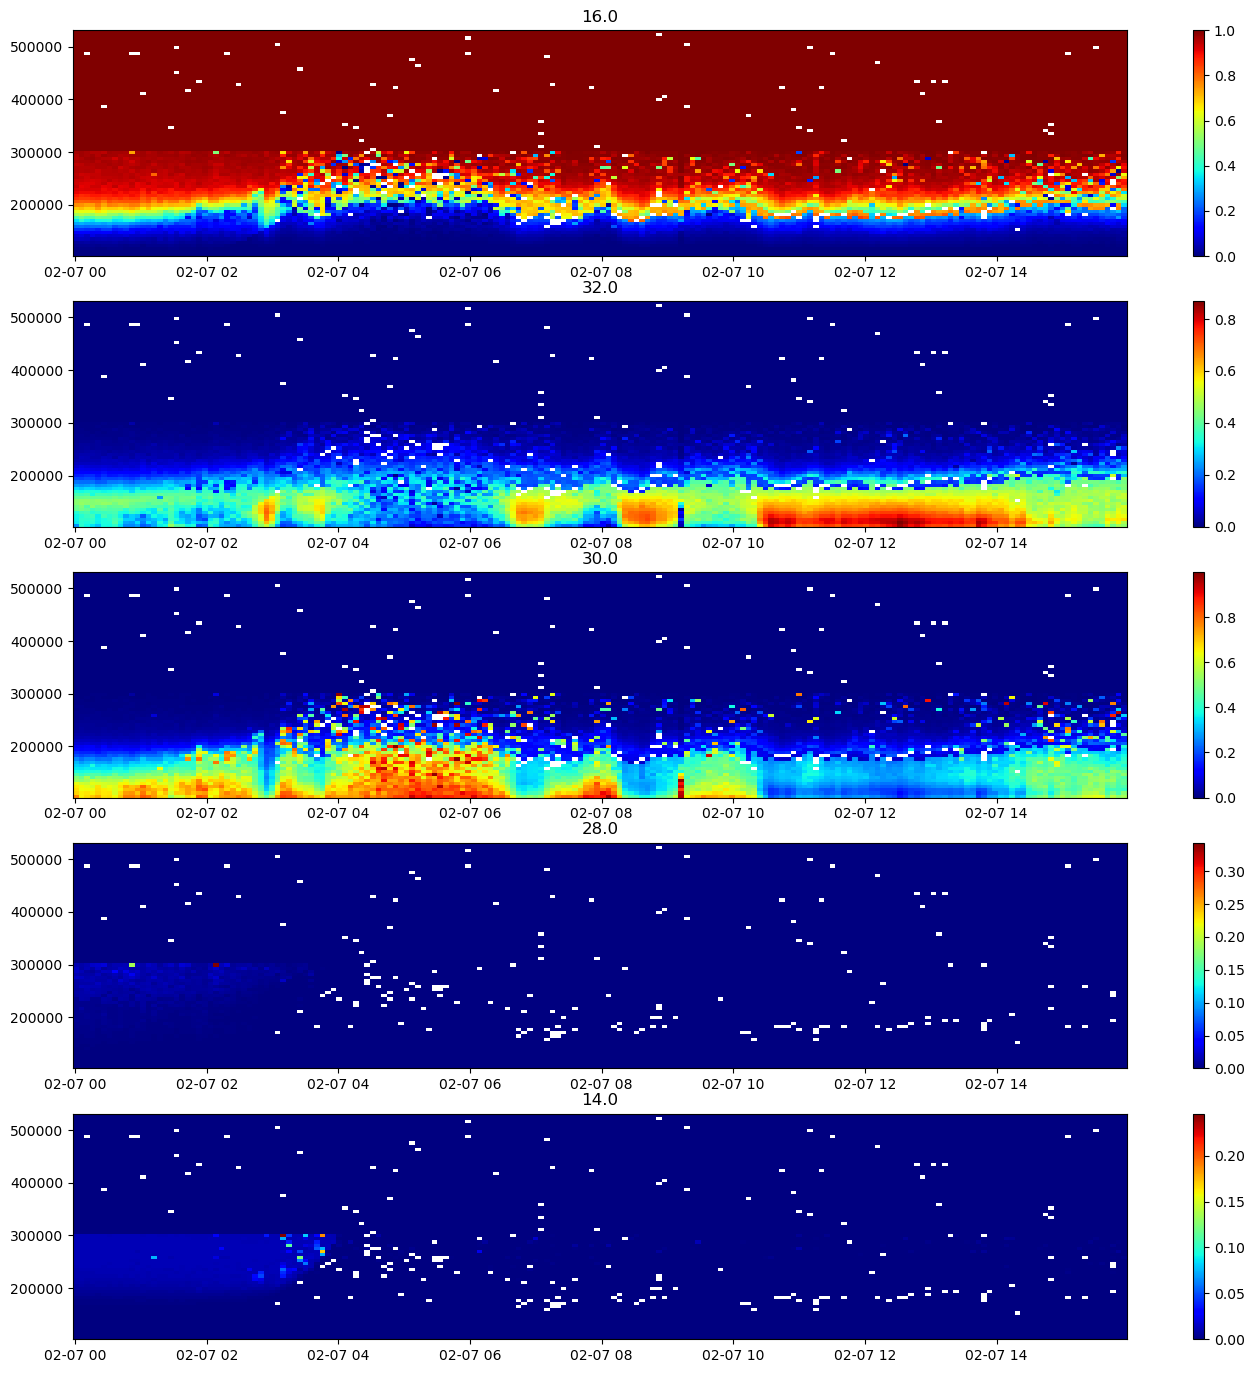
fig = plt.figure(figsize=(17,17))
gs = gridspec.GridSpec(len(ionmass),1)

finite_alt = np.isfinite(alt[10,:])

for i in range(len(ionmass)):
    ax = fig.add_subplot(gs[i])
    c = ax.pcolormesh(time, alt[10,finite_alt], comp[:,10,finite_alt,i].T, cmap='jet', vmin=0.)
    ax.set_title(ionmass[i])
    plt.colorbar(c)